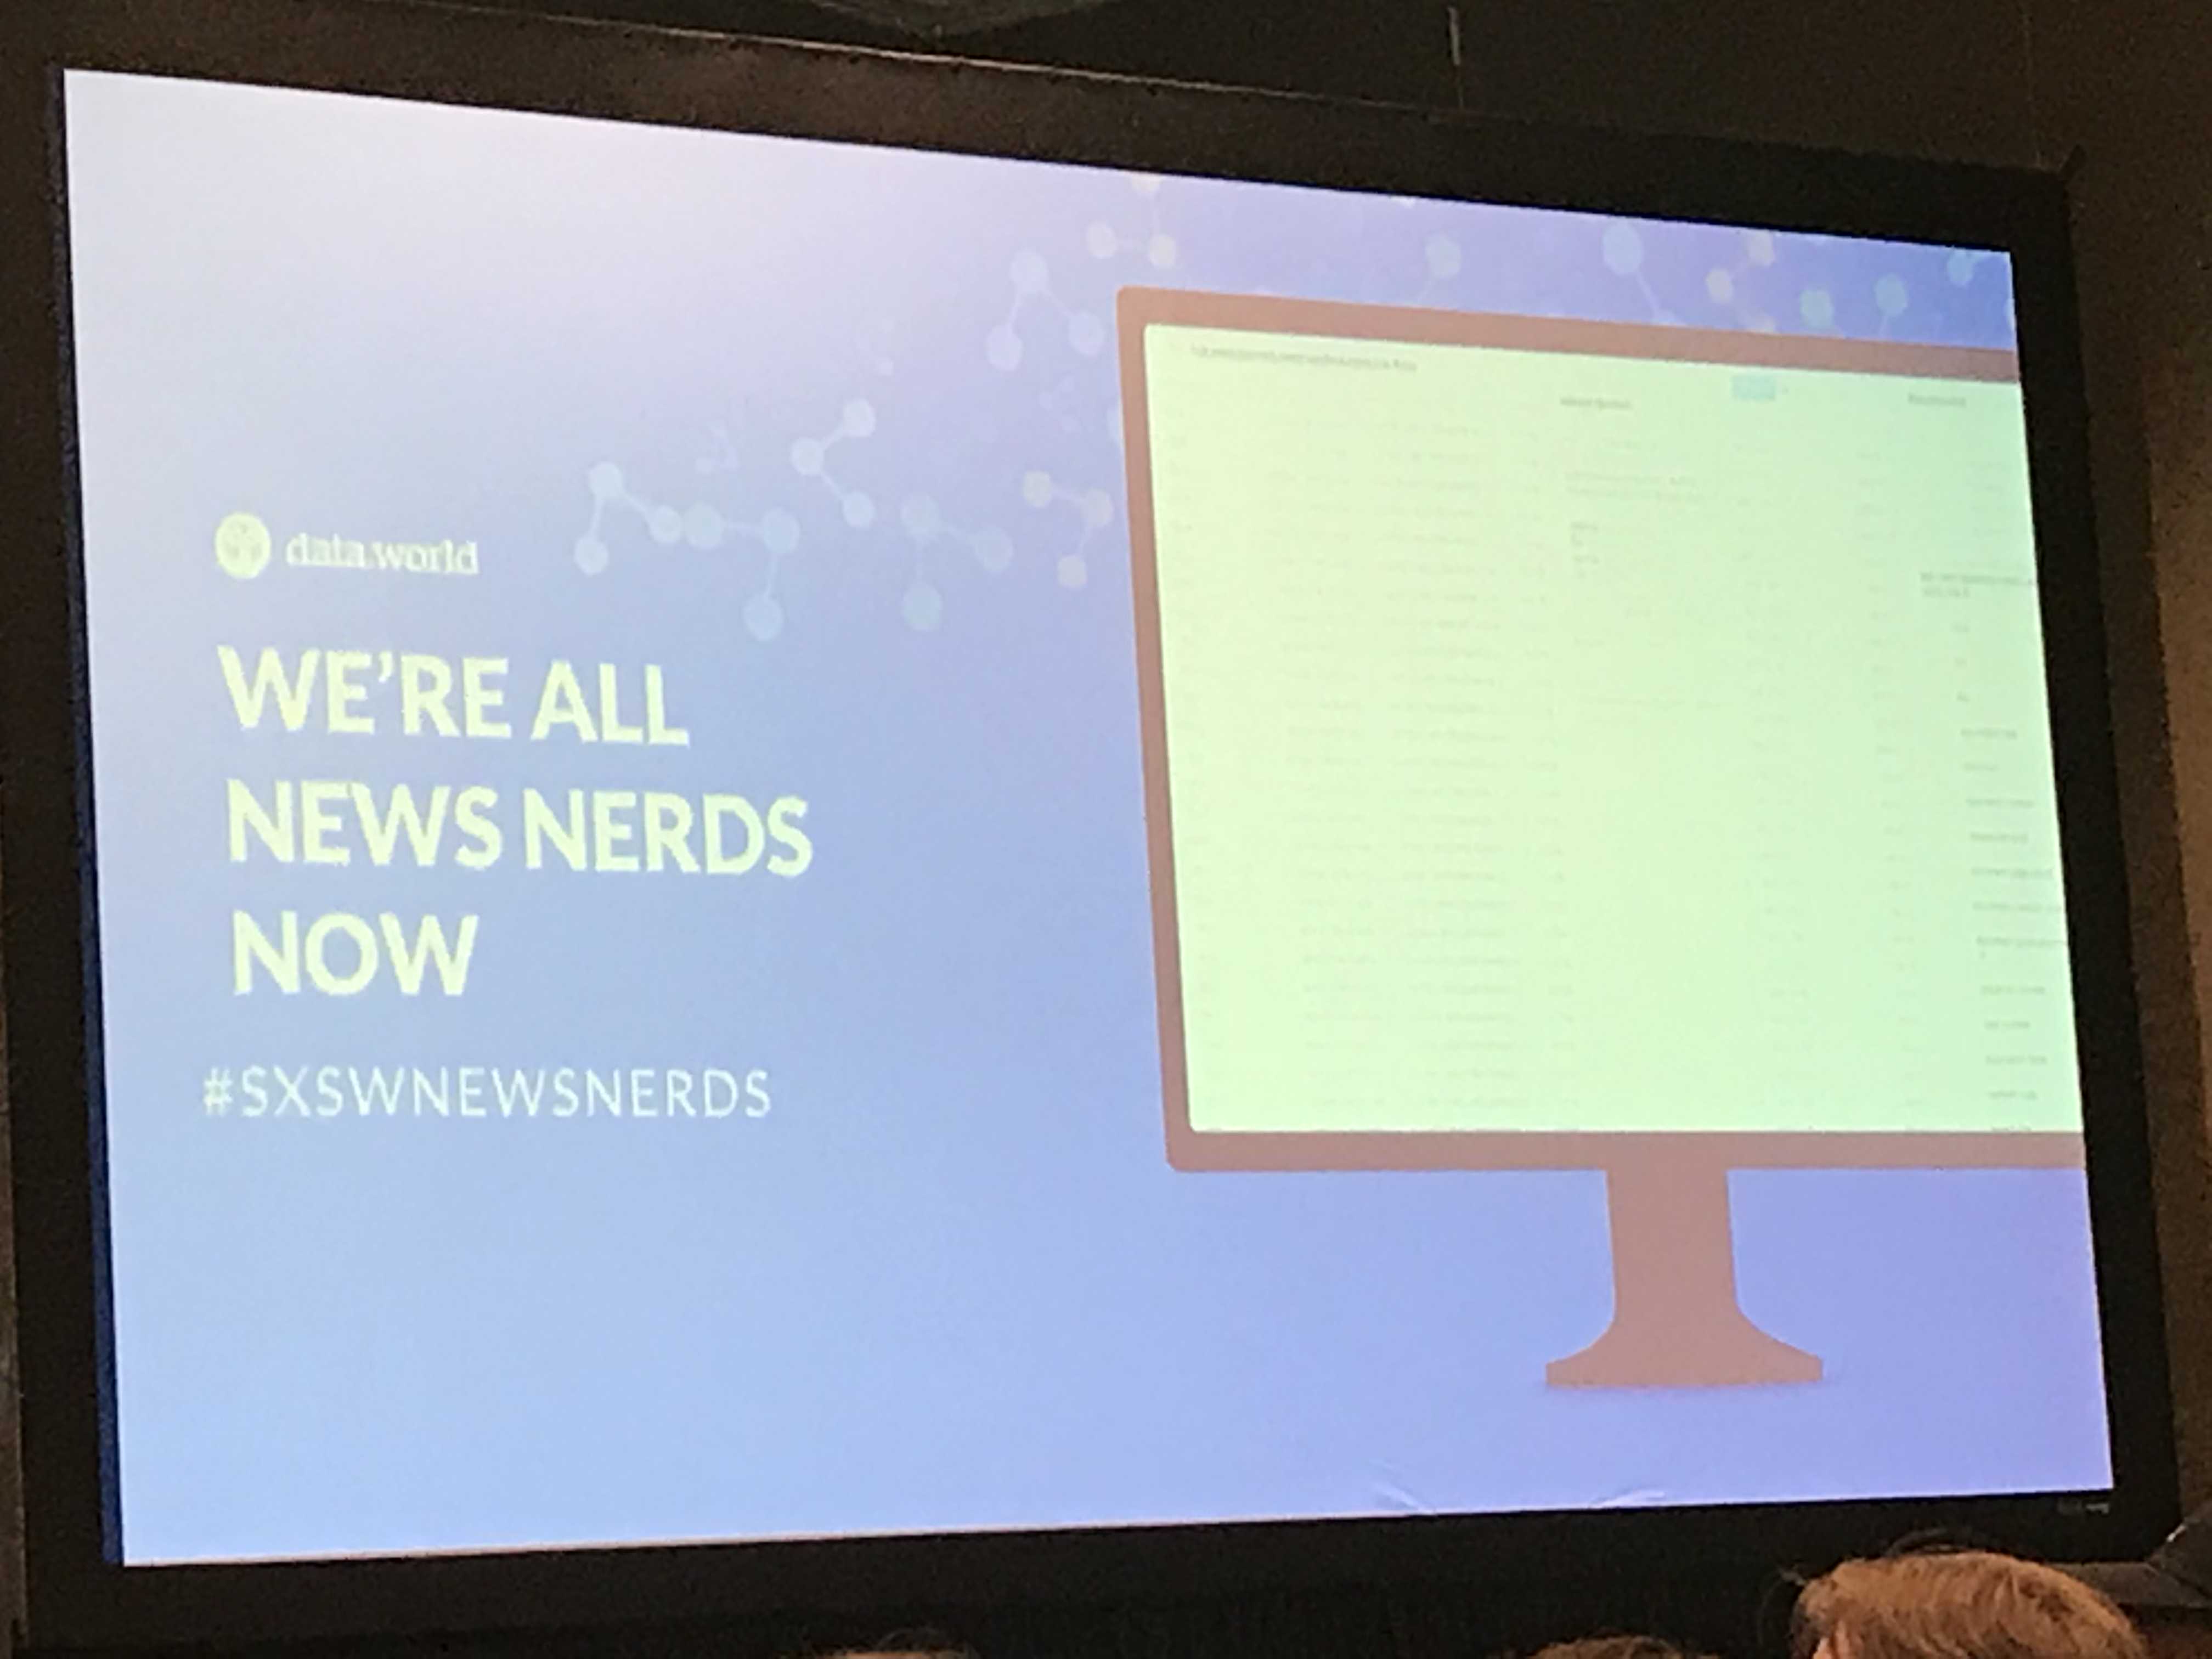
Data journalism is more than just journalism done with data. It is journalism that looks at data, analyzes it to find trends and context and displays it in a meaningful way for people to understand. On Saturday, a panel of journalism and tech leaders shared lessons and ideas about data journalism and data literacy.
The panel, Data Journalism: We’re All News Nerds Now, was hosted by Jon Loyens is the co-founder and chief product officer of data.world; Allison McCann, a data reporter with VICE News Tonight; Sarah Cohen, the Knight Chair in Data Journalism at the Walter Cronkite School of Journalism and Mass Communication at Arizona State University and Troy Thibodeaux, data science and news applications editor for the Associated Press.
At the start of the panel, Loyens described the importance of data journalism to society and its role in society. Part of being a journalist is adding accurate context to stories to help people understand the world around them, he said.
“One of the best ways we can add context to stories is with data,” he said. “The stories journalists write add context, add knowledge, add understanding and meaning back to the data. That, to me, is why data-journalism is so important.”
Loyens, who was the panel moderator, asked the other panelists for their view. He asked what data journalism meant to them.
Cohen said it was a way to hold the powerful accountable using documents and data rather than quotes and sources, or other material that might not be as accurate.
“I think that it is important, when we’re thinking about data journalism, that it’s not all about the data,” she said. “It’s about the story. So, we generally start with a story first and then move to data.”
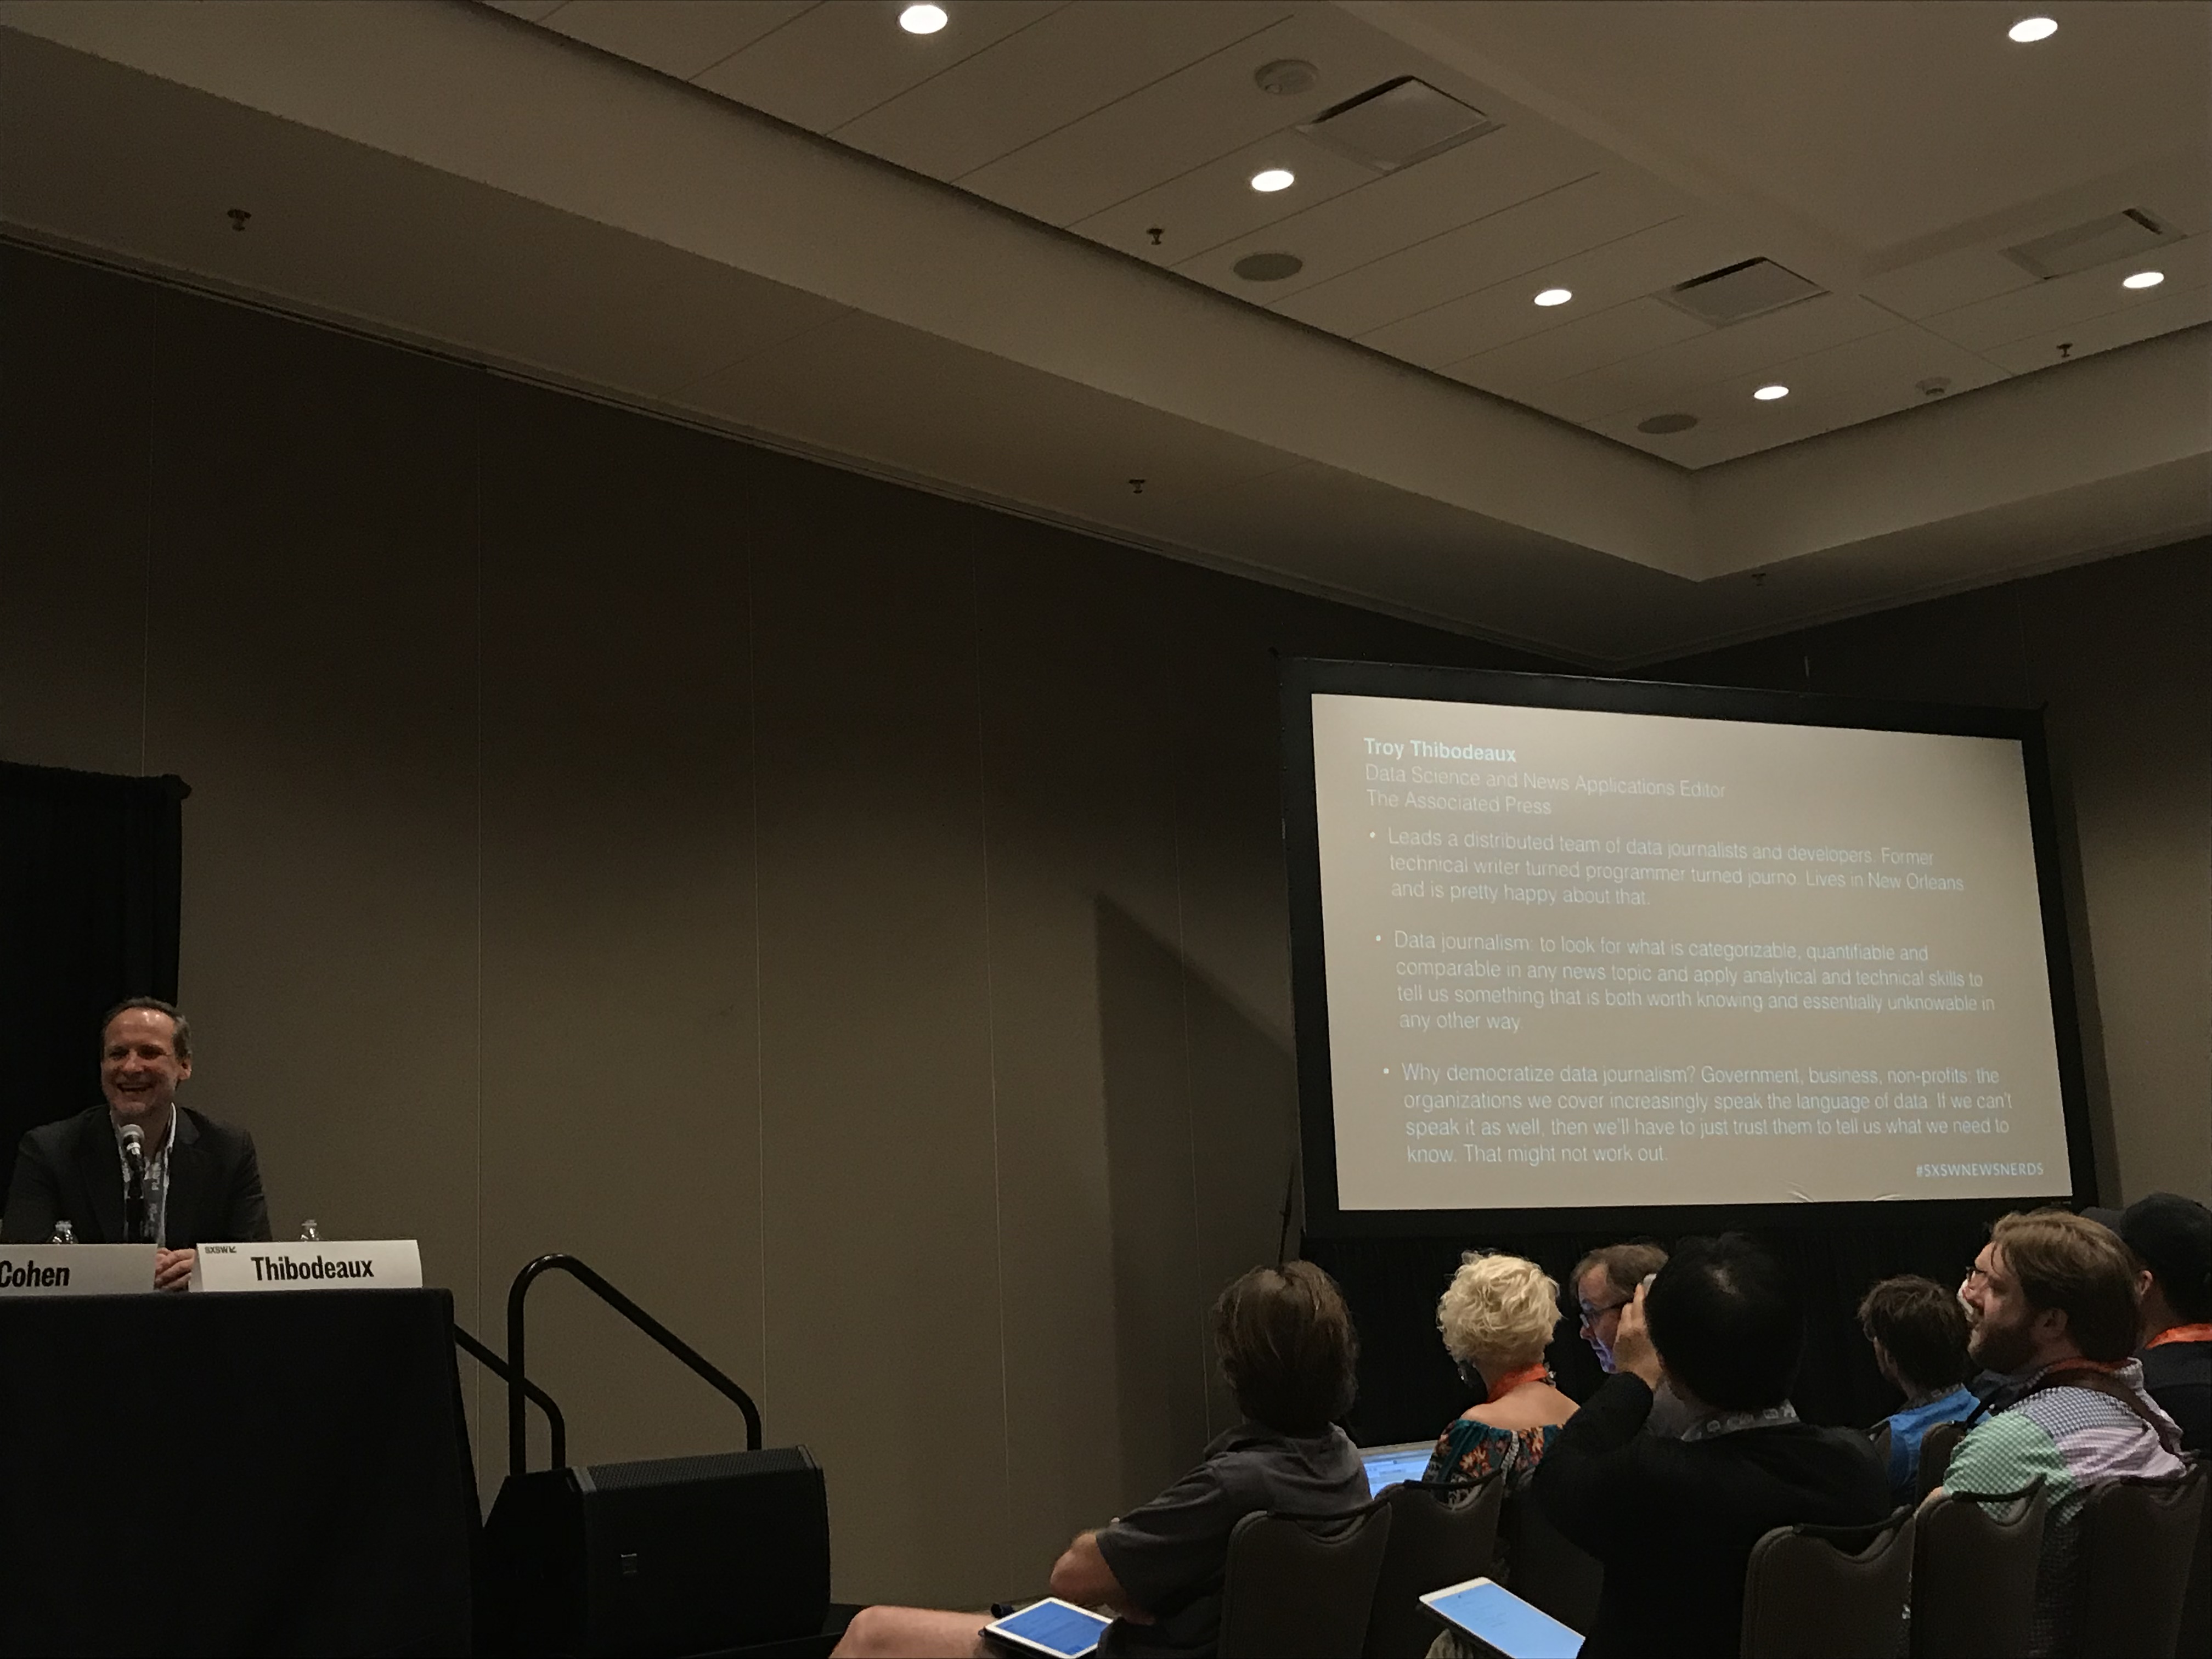
Thibodeaux said data journalism is made up of many things, and you take the skills of statistics, design and computer science, and meld them together to get the information people need.
“On one hand, it’s visualization—the presentation of data,” he said. “Then, there’s the way of knowing about something through data that you wouldn’t have known otherwise. And then there’s the way of presenting that and telling stories in a way you couldn’t have told otherwise.”
For McCann, she said she has worked as a data journalist since the start of her career and felt there wasn’t a distinction between data journalism and “regular” journalism. She said most journalists do things that they haven’t considered “data journalism” but that it is data journalism what they’re doing.
“For me, data journalism is always just journalism,” she said. “One of my journalism professors, Amanda Cox, said, ‘You know, we never call it words journalism.’ So, I think the differentiation of the two is changing a bit.”
Loyens next asked Thibodeaux about the status of the hopeful increase of data journalism in newsrooms.
“I’ve been with AP for eleven years now, and during that time, I would say the increase in data literacy and data skills has been marginal, but meaningful,” Thibodeaux said. “I think what has changed is people see the value of working with data.”
Cohen is a journalism professor at Arizona State University. Loyens asked her how the future of data journalism—teaching the next generation of data journalists—is going.
“I’ve only been at Cronkite for a couple of months, but I can say what I’ve seen in this generation of students and reporters,” she said. “There are so many mechanical skills required of being a reporter at this point. Now, you have to build your social media presence, audience analytics, you’re breaking stories at a pace that is considerably different and you’re really not considered a whole journalist anymore if you don’t know how to edit and shoot video and audio.”
Cohen said one of her concerns was there was very little room for reflection in journalism schools right now, so schools could still work to get more data literacy out of students and out of the other things that newsrooms are expecting out of new graduates.
As data journalism becomes more popular and newsrooms become more aware of its importance, data-driven stories are expanding into different beats. Lyons asked McCann where she sees an expansion of data-driven stories.
“I’ve really noticed a lot at VICE and elsewhere a big data push in civil rights and justice,” she said. “There was next to no data around police shootings three years ago. Newsrooms like the Washington Post and the Guardian started countering that, and then at VICE we gave a big effort to also track non-fatal shootings and that data previously never existed.”
People are expecting more data-driven stories in spaces that aren’t just politics and sports, she said.
Thibodeaux said every beat, and probably every story, has a data angle. Data rich beats include environment, education and technology, although technology is difficult to do stories on.
“Technology would be a great data beat, but it’s so hard,” he said. “You can’t FOIA private companies, right? You can’t make a public records request for a technology company, so how would you get the data to tell that story?”
Loyens next asked the panelists about the three fundamentals of creating a data-driven story: sourcing, interpreting and building a story for the audience.
“How do you think about sourcing data?” he asked the panelists. “How do you think about building data for a story? Do you use existing data sets, or do you use new data sets?”
McCann said since there was a proliferation of data-journalism, a lot of the existing data sets have been used or everyone’s looked at them—they were ones accessible to everyone.
“I’ve been creating my own data sets, sourcing my data,” she said. “If the data doesn’t exist, go out and compile it.”
Cohen said when she thinks about sourcing data, she thinks about going back to the real-world.
“You walk through all of the things in real-life that somebody does, and see where in that point it might be measured or have records that you can get through public records requests.”
She said you have to think about where you would get that data, and how much you would get at the city level, the state level or if you would have to go to the federal government.
“I like to think about what are the points where the real-world intersects with the government, because the government is the only real place that we have any right to get information from,” Cohen said. “Sometimes it doesn’t work and you have to say, ‘Okay, I’m going to create my own data.’”
Loyens asked Thibodeaux about what to do and how to treat third-party data sources for trusting their accuracy.
“I tell my team that every time they open their laptop, their mantra should be, ‘All data sets are very unequal,’ he said. “There’s an important process—it’s kind of a laborious process—that’s internal of checking the integrity of the data, and looking externally at the real-world at other data sets that might compare and seeing if it makes sense and is in line with other things.”
Thibodeaux said the Associated Press is fairly conservative about whose data they use and making sure it is not coming from an advocacy group. He said important questions to ask are why the third party is collecting the data, what was the purpose and what was the process. You should also background check data, the same way you would a person, he said.
“Who is this group and are they in a position to know this?” he said.
Loyens next asked the panelists about interpreting data, and what some of the tools they used to interpret it.
McCann said she is a huge fan of “R,” a statistical programming language.
“R is just wonderful for working with data and getting in there,” she said. “It has amazing graphing libraries and you can export SVGs, which we often bring into Adobe Illustrator and could even go into motion tools and things like that. I’m less on the web now, and more in the JavaScript and D3 world now.”
Thibodeaux said his team was always looking for new tools, and some things they build themselves to interpret the data using open source tool kits. He said the Associated Press also works in the “R” ecosystem, and finds some things that were once hard to do are now really easy.
“We’re also always looking for ways to visualize data easily and quickly, that doesn’t require writing JavaScript,” he said. “We use D3 or things built on D3 to analyze data.”
Data journalism can be used to tell meaningful stories backed by data and their trends for issues that affect society and communities. Attendees had the chance to learn about data-journalism and ways they could create better data-driven stories.