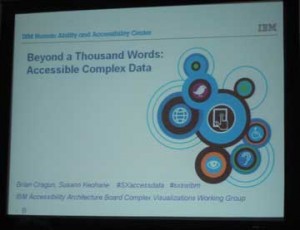
Data visualizations gained popularity as a means to capture large amounts of information to create visually appealing and simplified means of explaining information.
Some companies have begun to use graphical representations to show differences and quantities of data in a simplified form and provide more access to people with disabilities.
“Graphical visualizations provide lots of information quickly and can highlight relationship, patterns and creates a connection to users,” said Susann Keohane, IBM Accessibility Architecture Board.
Keohan said that complex visualization are good for comparing and contrasting the changes in data when individual parts are just as important as the whole.
“You can get size information and density of the information easier through visualizations,” said Keohane. “Your eye picks up on your subtle differences between things.”
Brian Cragun, IBM Accessibility Architecture Board, said data is more evident to users in differentiating what is bigger and smaller when data is visualized beyond traditional charts and graphs.
IBM Accessibility Architecture Board Complex Visualizations Working Group continued to work on new ways to bring more access to people with disabilities by looking at ways to filter out data to the needs of users.
“We design for the core disability,” said Keohane. “It is important to create with every disability in mind to create new data to share. So, everyone needs to be able to access it.”
Other methods of creating new visualizations and creating more accessibility included the reduction of complex data into simpler terms and creating new ways for users to interact with data sets.
“When you do that, people can find what is important to them and not have someone else say what is important about the data,” said Cragun.
Other future methods of large data interaction for people disabilities are air grids which use acoustic radiation pressure and piezoelectric sensors in devices like phones or tablets.
“We [IBM] don’t have answers and solutions, but [the future] must provide different ways for users to interact and discover data,” Keohane said.

Permalink
This is important stuff, especially for organization like the Census that generate lots of public data. Oh, and making it accessible to humans with disabilities is useful to machines like IBM Watson too!